

Creative velocity is the rate at which a team ships new, materially distinct ad variants relative to spend, and it directly governs how fast your CAC climbs and how quickly you can find winners. Raising velocity from a sluggish pace to a strong one has been tied to 20–35% CAC reductions within weeks. The rest of this piece covers how to measure it, why it moves cost per acquisition, and exactly how to build more of it without wrecking brand quality.
TL;DR:
- Maintaining a creative velocity between 1.5 and 3.0 new variants per $10,000 spend weekly generally reduces CAC by 20-35% within six weeks.
- Segment velocity targets by channel, format, and funnel stage to optimize testing without overwhelming your team or diluting insights.
- Fixing bottlenecks like footage supply, approval delays, and lack of clear hypotheses can significantly increase velocity without proportional cost increases.
- Using virtual assistants for rapid variant production can generate 15 or more new ad variations weekly, lowering CAC without internal staffing costs.
- Prioritize rapid testing for top-of-funnel hooks while controlling brand risk through structured review processes to avoid damaging brand trust.
Table of Contents
- What Is Creative Velocity and How Do You Measure It?
- Why Does Creative Velocity Control Your CAC?
- How Do You Actually Increase Creative Output Fast?
- What Should Your Creative Velocity Dashboard Track?
- Where Do Most Creative Velocity Efforts Break Down?
- What Does This Look Like Applied? A Managed VA Example
- The Honest Trade-Off Between Speed and Brand Control
- Get 15+ Fresh Ad Variants a Week Without Hiring an Editor
- Sources
What Is Creative Velocity and How Do You Measure It?
Creative velocity has two workable definitions, and most performance teams need both.
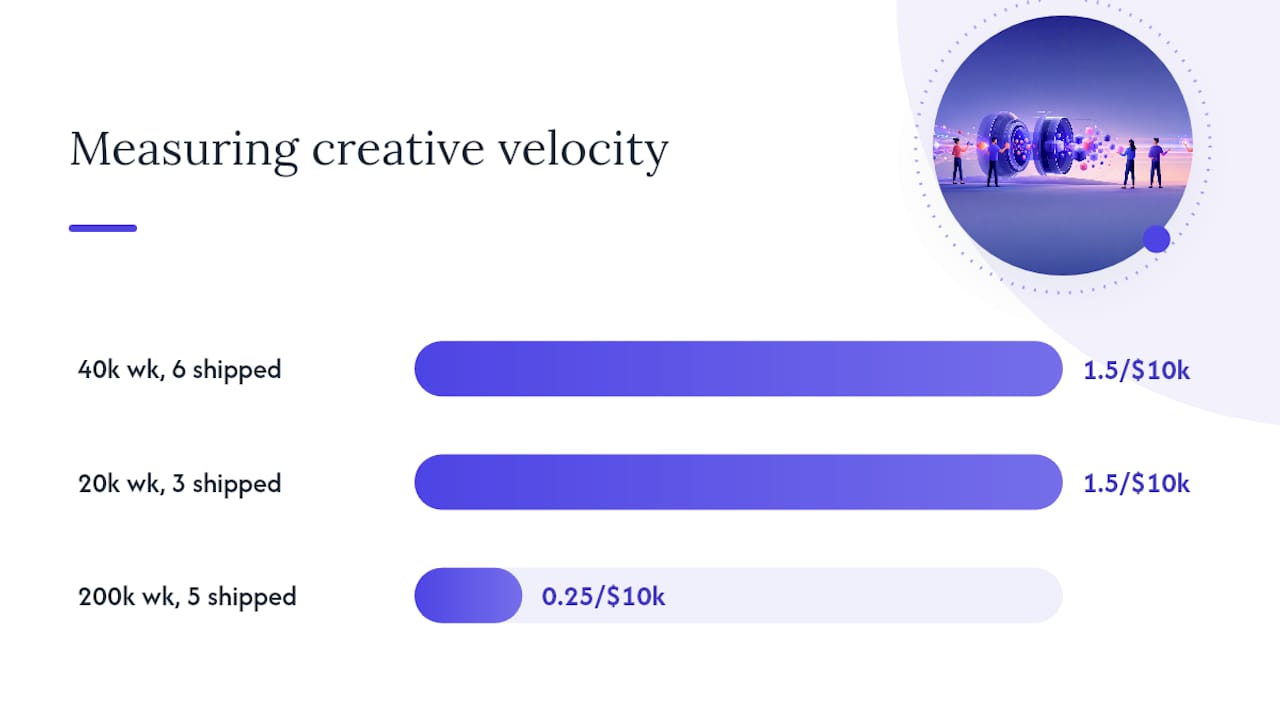
The first is a spend-normalized production formula: new creatives deployed divided by every $10,000 of ad spend per week. Say your account spends $40,000 weekly and your team ships six genuinely new variants (different hook, cut, or thumbnail, not a re-upload). That's a velocity of 1.5. This formula matters because it accounts for scale. A brand spending $200,000 a week shipping five variants is actually moving slower than a $20,000-a-week account shipping three.
The second method skips internal spend data entirely. You count first-seen unique creative variants per week directly from public ad libraries like Meta Ad Library or TikTok's Creative Center. This is the only option for competitive benchmarking, since you can't see a competitor's spend.
One distinction trips up almost every team building this out for the first time: a "new upload" is not the same as a true new variant. Swapping a caption or re-targeting the same clip to a different ad set doesn't count. A real variant changes the hook, the cut, the thumbnail, or the offer in a way a viewer would actually notice.
Once you're counting correctly, segment the number three ways:
- By channel — Meta, TikTok, and YouTube fatigue at different rates and need separate velocity targets.
- By format — static, short-form video, and long-form each have different production costs per variant.
- By funnel stage — top-of-funnel hooks need far higher throughput than retargeting or bottom-funnel offer creatives.
A single blended number across all three tells you almost nothing actionable.
Why Does Creative Velocity Control Your CAC?
The mechanism is straightforward and depressingly linear. A winning ad runs, frequency climbs as the algorithm keeps showing it to the same pool of people, and click-through rate starts dropping around the third or fourth exposure. Lower CTR means the platform charges more per click to hit the same auction placement, so CPC rises. Rising CPC with flat conversion rates pushes CAC up. The only lever that resets this cycle is fresh creative that hasn't been seen yet. Velocity is how fast you can pull that lever.
Industry benchmarks group accounts into three practical tiers, based on new creatives per $10,000 in weekly spend:
- Below 1.0 — CAC inflation risk. You're feeding the algorithm stale assets faster than it can serve them without fatigue.
- 1.5 to 3.0 — the optimal range for most direct-response accounts, though the right number shifts by channel.
- 3.0 and above — elite territory, typically reserved for teams running heavy modular production or AI-assisted pipelines.
The number that matters: accounts that moved from roughly 0.8 to 2.0 on this scale saw CAC drop 20 to 35% within four to six weeks, with spend held constant.
Meta and TikTok fatigue noticeably faster than YouTube or search, mostly because their feed algorithms serve the same winning ad to overlapping audiences more aggressively. A channel-specific benchmark matters more than a single company-wide velocity target. Teams running dozens of variants weekly through modular and AI-assisted production have reported 30 to 50% ROAS improvements alongside faster learning cycles, largely because more tests running in parallel means more data per week, not just more creative.
How Do You Actually Increase Creative Output Fast?
Start by baselining where you actually stand, not where you assume you stand. Pull the last eight weeks of true new-variant counts (using the "materially different" standard, not upload counts) against weekly spend, then plot it by channel. Most teams find their real bottleneck within the first hour of this exercise, and it's rarely the one they expected. It's usually one of three things: the raw footage pipeline is too thin, the editing queue backs up behind one person, or approvals sit in someone's inbox for four days before anything ships.
Here's a sequence that tends to work regardless of which bottleneck you find:
- Fix the footage bottleneck first. One raw video, shot once, should output five to ten channel-tailored variants through re-cutting, reframing, and swapping hooks. This modular approach is the single most cost-efficient way to raise velocity without a proportional budget increase.
- Add a human-in-the-loop production layer. AI tools handle repetitive editing tasks like resizing, captioning, and basic cuts well. Judgment calls, like which angle to test next or whether a creative fits brand voice, still need a person. The most durable frameworks split it this way: AI on production, humans on judgment.
- Build parallel approval lanes. A single sequential approval chain is the most common velocity killer in mid-size teams. Split review into a fast lane for low-risk format tests and a slower lane for anything touching brand claims, pricing, or new offers.
- Write a hypothesis before every batch. "Test five variants" is not a plan. "Test whether a founder-led hook outperforms a UGC-style hook on cold traffic" is. Isolate one variable per batch (hook, thumbnail, or offer, not all three) so a result actually means something.
- Set a speed-for-rigor trade-off you're comfortable with. Waiting for full statistical significance on every micro-test will cap your velocity permanently. Many performance teams accept directional signal at smaller sample sizes for early-stage hook testing, then apply stricter thresholds only once a variant reaches scaling budget.
Pro Tip: Keep a running "hook bank" of angles that tested well even on losing creatives. A hook that got strong three-second view-through on an otherwise weak ad is often the seed of your next winner. Most teams throw this data away because it lived on a "failed" test.
Creator partnerships and dedicated production teams solve the footage bottleneck specifically. If your internal team can shoot but can't edit at the pace your spend demands, that's a resourcing problem, not a strategy problem, and it's usually the fastest one to fix.

What Should Your Creative Velocity Dashboard Track?
A velocity dashboard that only shows a single weekly number will mislead you as often as it helps. Track velocity alongside its context, not in isolation.
The core KPI set:
- Creative velocity (new variants per $10,000 spend per week), segmented by channel
- Raw new-variant count, so you can tell if a velocity drop is a spend increase or an actual production slowdown
- CTR, CPC, and CAC, tracked weekly against the velocity line to spot the fatigue curve as it starts
- ROAS, tracked at the campaign and creative-archetype level, not just account-wide
- Tested variants per hypothesis, which confirms volume is generating real tests rather than noise
Segment every one of these by channel, campaign, and creative archetype (UGC, founder-led, static offer, and so on). A blended dashboard hides which format is actually driving your velocity gains.
Cadence matters as much as the metrics themselves. Review velocity weekly as the baseline rhythm for most accounts, but shift to daily monitoring for high-spend accounts where a fatigue spike can burn budget fast before anyone notices. Set an alert when velocity drops two consecutive weeks while spend holds flat.
Interpretation is where most teams get sloppy. A jump from five to twenty weekly variants often signals a team that found a working angle and is racing to exploit an early window before competitors or algorithm shifts close it. But velocity climbing while spend stays flat can mean the opposite: a team patching a fatigued account rather than genuinely scaling. Read velocity next to the spend trend, never alone. For competitive intelligence, pair your internal spend-backed number with a weekly ad-library pull on competitors; the combination tells you whether an entire category is accelerating or whether it's just one account desperately treading water.
Where Do Most Creative Velocity Efforts Break Down?
Three failure modes show up constantly, and all three have simple fixes once you name them.
- Volume without a hypothesis. Shipping fifteen variants with no stated variable to test produces fifteen data points you can't interpret. Fix: require one written hypothesis line per batch before production starts.
- Approval bottlenecks eating the speed gains. Teams fix production and then lose all the gained time to a four-day sign-off chain. Fix: parallel review lanes, with low-risk formats approved same-day.
- Treating rising velocity as automatically good. High velocity with flat or declining CTR usually means the team is producing noise, not tests. Fix: track tested-variants-per-hypothesis, not raw output, as the real health metric.
Velocity becomes noise, not signal, the moment output outpaces your team's ability to actually read results and act on them. Brand guidelines don't have to slow this down if they're built as go/no-go checklists rather than open-ended review, which is what usually turns approval into a bottleneck in the first place.
Pro Tip: Give your approval team a one-page checklist (logo placement, claims accuracy, tone) instead of open review. A checklist takes two minutes; a subjective "does this feel right" review takes two days.
What Does This Look Like Applied? A Managed VA Example
Wing Assistant's model is built around exactly the bottleneck most teams hit first: the footage-to-finished-variant pipeline. Dedicated virtual assistants take a single raw video and turn it into multiple distinct ad variations rather than one polished cut, which is the modular production pattern that raises velocity without a proportional spend increase.
The reported numbers give a concrete reference point for what "solving the bottleneck" looks like in practice:
- 24 to 48 hour turnaround on new variants, versus the multi-day cycles typical of traditional agency workflows
- A 31% reduction in cost per acquisition reported by brands using the service to keep creative fresh
- Continuous variant pipelines that keep pace with weekly ad-library and spend-backed velocity targets rather than one-off production sprints
This directly addresses the two most common bottlenecks from the playbook above: a thin footage-to-edit pipeline and an approval process that can't keep pace with the volume a modern account needs. Teams get 15+ new hooks weekly without hiring a full internal editing staff, freeing marketers to spend their time on strategy and hypothesis design instead of timeline chasing.
The Honest Trade-Off Between Speed and Brand Control
Most velocity advice pretends speed and brand safety never conflict. They do, regularly, and pretending otherwise is how brands end up with a viral hook that embarrasses legal six months later.
Three rules keep this sane: give low-risk format tests same-day approval, require full review only for anything touching claims, pricing, or a new offer, and never let a "test" stay live past the point where it's clearly a scaling decision in disguise. Prioritize velocity on top-of-funnel hook testing, where being wrong costs you a few hundred dollars. Prioritize brand control on anything a customer might screenshot and hold against you later. A team producing twenty variants a week that all sound like a stranger wrote them didn't win. They just found a faster way to lose trust.
— James
Get 15+ Fresh Ad Variants a Week Without Hiring an Editor
If you've read this far, you already know the fix for creative fatigue isn't a better hook, it's a faster pipeline. Jamesyee replaces the multi-day agency turnaround with dedicated virtual assistants who take one raw video and turn it into a full week of distinct, channel-ready variants in 24 to 48 hours.
Brands running this model report a meaningful drop in cost per acquisition, largely because the creative rotation never falls behind the algorithm's appetite for fresh assets. You get the modular production pattern this article covers (one shoot, many variants) without staffing an internal edit team or negotiating a retainer with an agency that ships three ads a week. If your account's velocity is sitting below the 1.0 threshold that risks CAC inflation, see how the turnaround works and get a read on how many new variants your current spend should be supporting.
Sources
- Creative Testing and Velocity: Metric That Controls Your CAC in 2026
- Creative Velocity: The Scaling Metric Hiding in Plain Sight | Daily Intel Service
- Creative Velocity: The New Growth Lever - GrowthMarketer